Category: Economics
-
BoP cost in China
I stole this video from Gang Wang’s LinkedIn post. I saw in his profile that we were colleagues at Vestas years ago. A typical 20x5MW-191 HH160 hybrid ONWTG 100MW project’s CAPEX breakdown in CN mid-east low wind speed area: WTG: 1,600 RMB/kWHybrid Tower: 800 RMB/kWBOP: 1,400-1,800 RMB/kW The video is especially interesting for two reasons:…
-
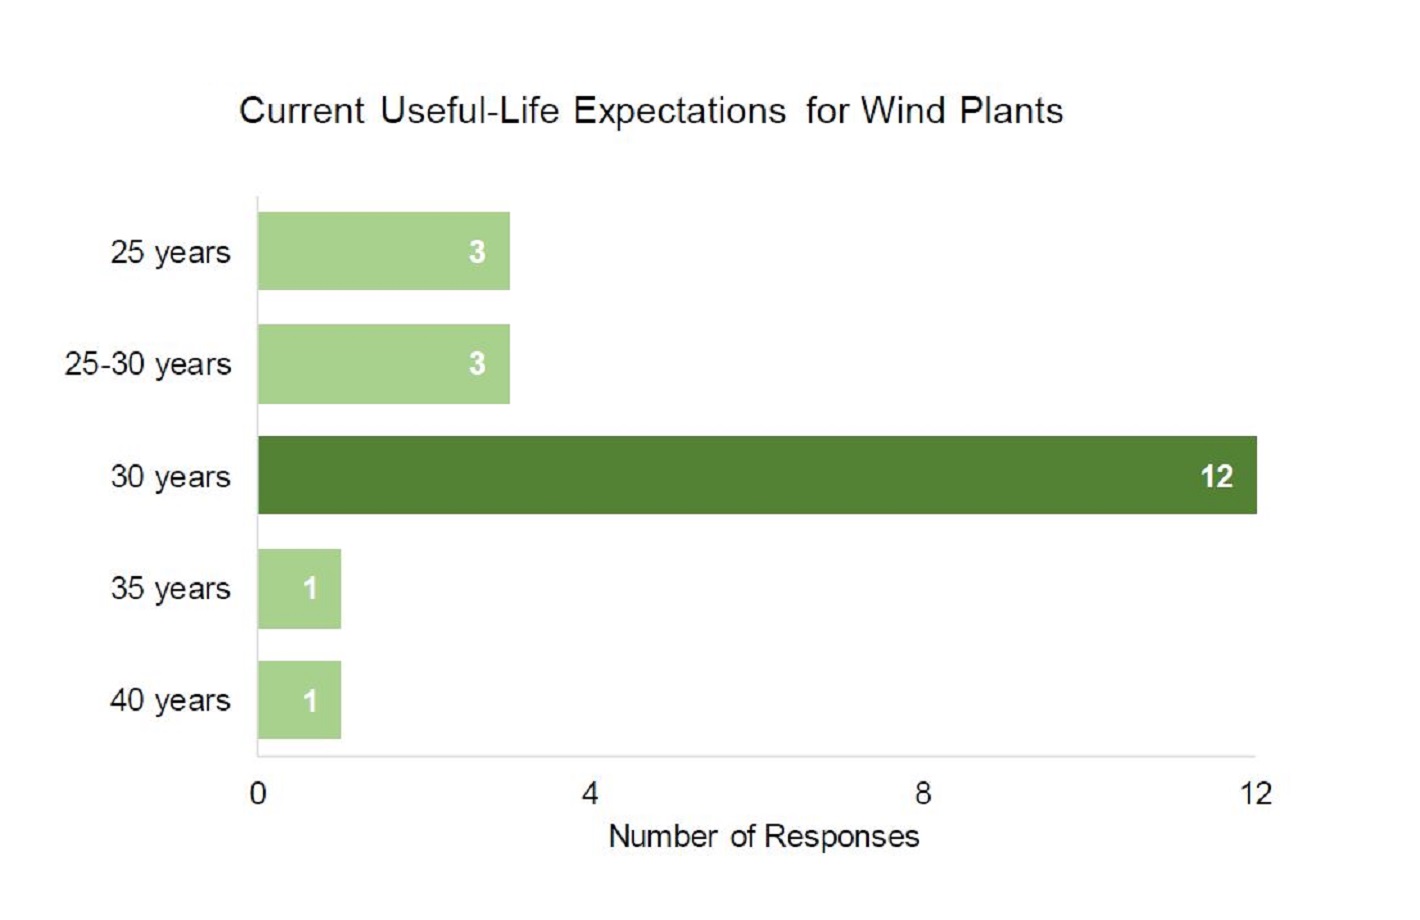
Live Long and Prosper: useful life of wind farms
The useful life of wind farms continues to increase. When I started working on the first wind projects in the 2000s, the ‘standard’ useful life was 20 years.Now it is not uncommon to see projects with a useful life of 30 or 35 years, and it seems that in some cases it is up to…
-
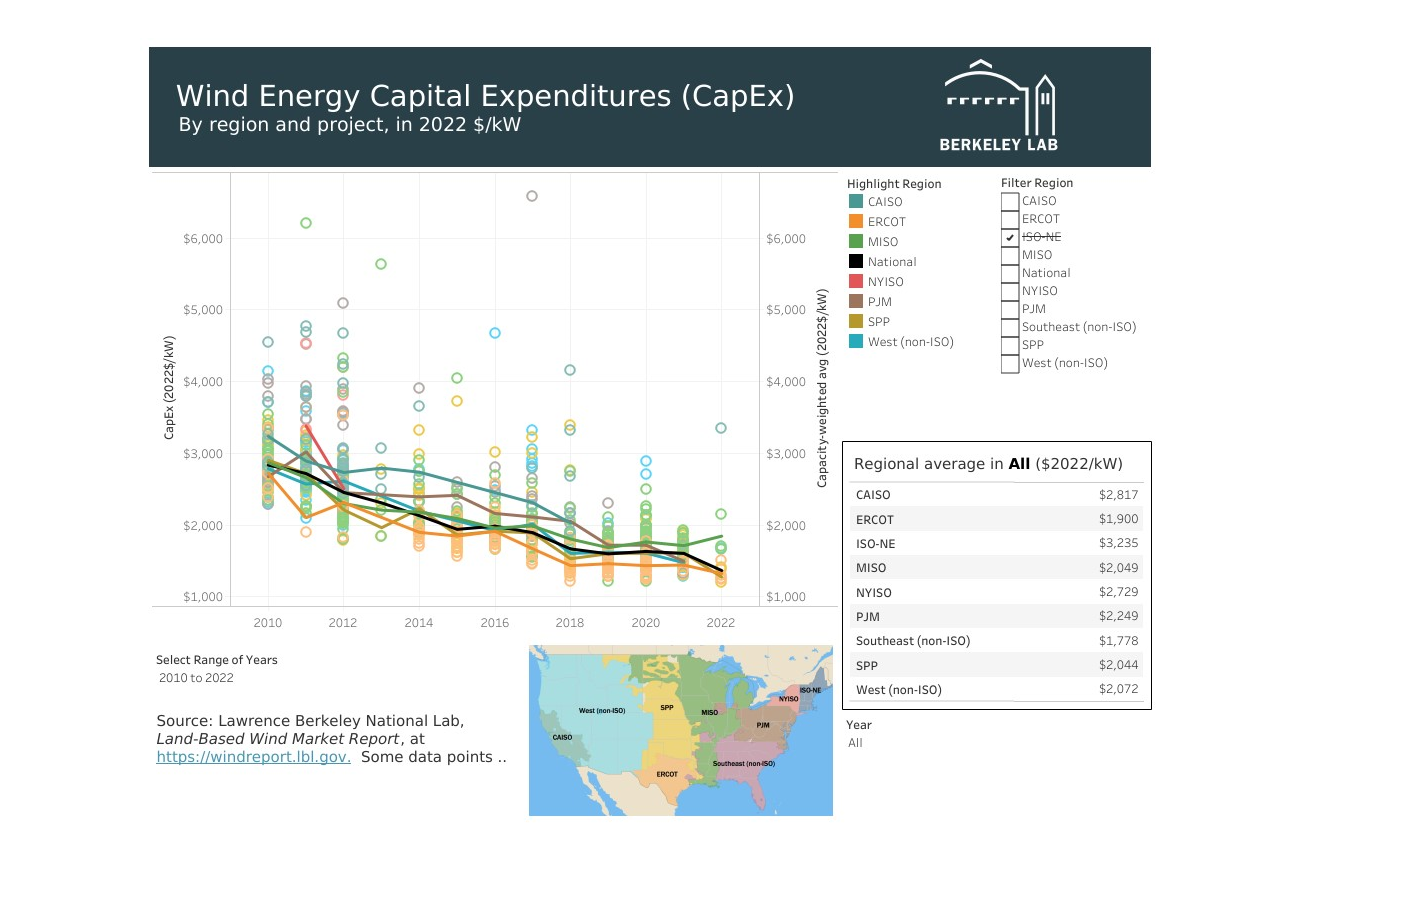
Evolution of wind energy CapEx in the US
Wandering around the net, I found this interesting dataset of US wind projects:https://emp.lbl.gov/wind-energy-capital-expenditures-capex It is the parte of thw ‘Land-Based Wind Market Report 2022‘ study, done by Lawrence Berkeley National Lab for the U.S. Department of Energy (DOE). It is a very interesting collection of data – the CapEx of dozens of wind projects built…
-
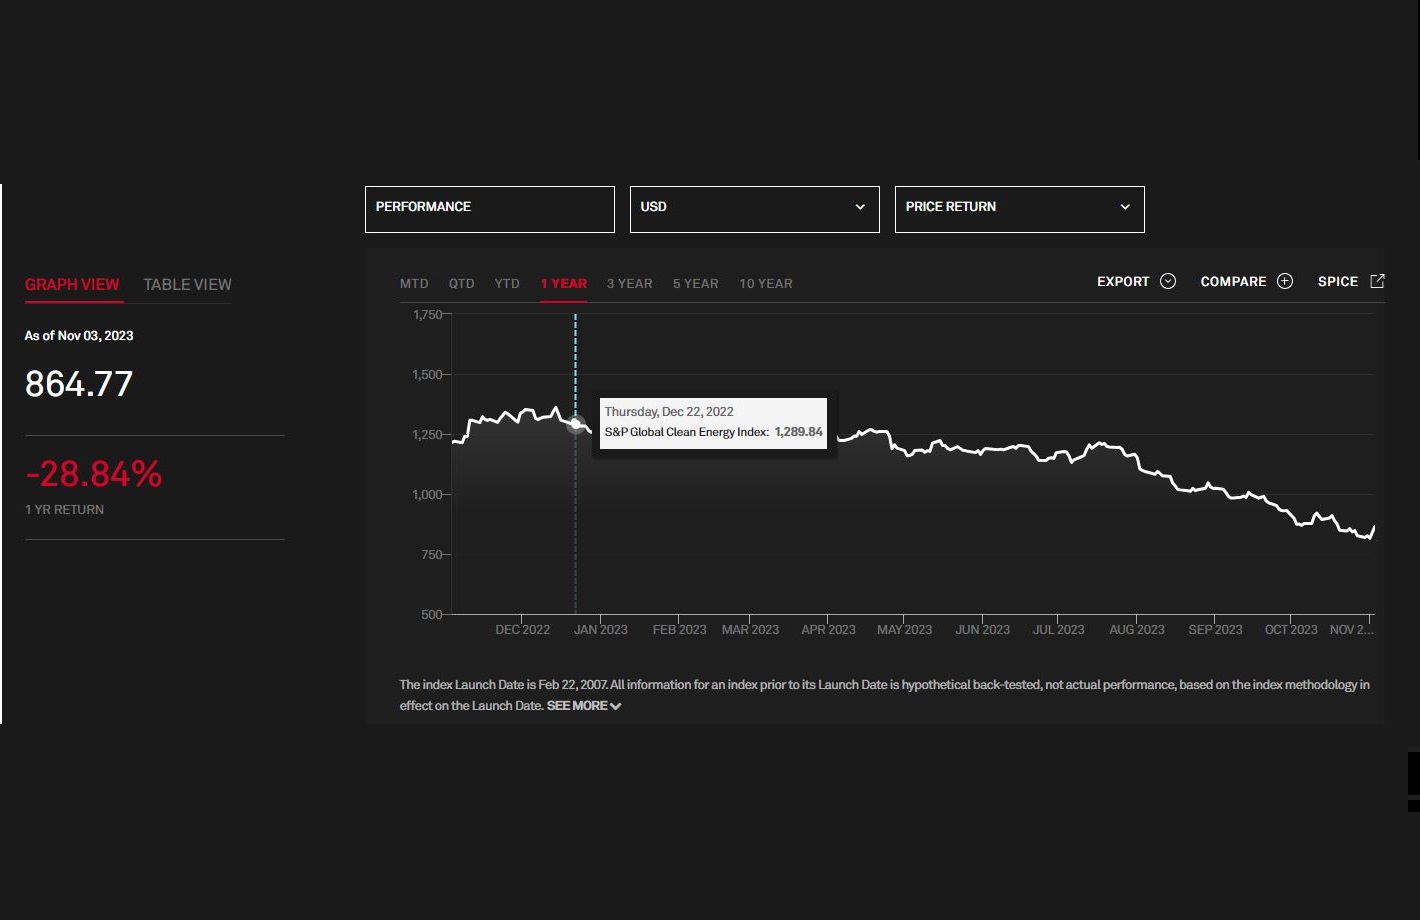
Deep Impact: rising interest rates & wind energy
How strong was the impact of rising interest rates on the renewable energy sector? A lot, if we look at the S&P Global Clean Energy index. The index consists of the major companies in the renewable energy sector – not only folks likes of First Solar, Vestas and Ørsted (formerly Dong Energy), but also Chinese…
-

Pandemic, war, inflation & Balance of Plant
What were the consequences of the pandemic and the war in Ukraine on balance of plant (BoP) prices? If you are reading this article, you probably know that the Balance of Plant (BoP) refers to all civil and electrical works necessary for the operation of a wind farm, excluding the turbines. The BoP will therefore…
-
BoP vs. BoS – similarities and differences
As the world continues its transition towards renewable energy sources, wind farms and photovoltaic (PV) solar plants have become essential players in the quest for sustainability. These two technologies harness the power of nature to generate clean electricity, and while they may seem quite distinct, they share common elements in their infrastructure. Lately I have…
-
How good is the wind farm you are working at? Some indicators
So, how good is the wind farm you are working at? There are several parameters that can be used to assess a renewable energy project and to compare different projects. Among the most used, it is worth mentioning the Capacity Factor, NPV, IRR and LCOE. Capacity Factor is the ratio between the actual energy production…
-
How many of us are there? Wind energy sector employees
It is no secret that the wind business is going through a turbulent period, with several players in the sectors experiencing a tough time. I was wondering how many people are currently employed in Wind and I have found this interesting report from IRENA (the International Renewable Energy Agency). I have discovered several interesting things:…
-
BoP strikes back: the increasing relevance of Balance of Plant
A key difference between combined cycle plants and wind or solar plants is the CAPEX / OPEX distribution. According on recent data of the American Department of Energy, for a combined cycle plant the CAPEX will be only around 25%, being the overwhelming majority of the investment in operational costs (that is, fuel) and maintenance….
-
Automatic cost estimator – the Holy Grail of BoP
Yesterday I had the pleasure to drink an overpriced coffe (2,90€ for an Espresso? Really?) with my good friend José Ramón. He told me that I’m not writing on the blog often enough so I’ve decided to make an effort and find some time to write this post. The subject I have selected is an evergreen…