The Site Assessment report (also known as wind resource assessment or site suitability) is a document containing the results of a detailed study to confirm that a specific turbine model can be used in a project and how much energy it will produce.
Both points are extremely important: not only is it necessary for the project to be economically viable, but it is also crucial that the turbine can withstand the expected conditions for its entire service life.
In general, the wind data are provided by the customer, while the study can be conducted by the turbine manufacturer or specialised companies.
The report considers as input various climatic data (air density, temperature, average and extreme speed) and the topography of the area (which affects turbulence and wind quality).
Wind data is collected by one or more meteorological towers (also known as met mast), which the site developers install in the project area. It would be good practice to have at least one year’s worth of data available, in order to consider seasonal effects (e.g. the wind may blow stronger in winter).
In general an even, flat terrain without vegetation is best for installing a wind project.
The report will estimate the gross Annual Energy Production (AEP) and various losses.
The most significant losses usually result from the wake effect, or the implementation of special strategies.
Wake Losses are production losses due to the fact that the turbines are close to each other, and therefore interfere by creating vortices, wakes and turbulence and decreasing wind quality – and ultimately producing less.
Special strategies (known as “curtailment“) can stop the turbines when certain circumstances happen (maybe we want to limit noise, avoid killing bats or other unwanted effects, or we have limitations from the grid).
Other losses are due to the turbine not producing all the time (perhaps it is undergoing maintenance, or has a problem) and electrical losses in cables or transformers.
Of course, the results of the report will have a margin of uncertainty – the worse the quality of the data, the wider the margin of error.
Standard sources of uncertainty are:
- Wind data. Even in cases where you start with quality data, there is a risk of a radical change in climate over the 20-30 year life of the project.
- Extrapolation of data (e.g. wind speed is collected with a 60 metre tower, but the turbine is 100 metres high).
- Location of the meteorological tower (if it is representative of the situation in the wind farm). Often more than one met mast is installed, to have a broader picture.
- Terrain modelling: if the mapping is of low quality, local turbulence phenomena will not be taken into account.
The study is usually done using software like WindPro or WAsP (wind atlas analysis and application program). Both software assess the wind resource potential and help checking the feasibility and performance of wind energy projects.
The loads on the wind turbines are calculated following the IEC 61400-1 standard. IEC 61400-1 is part of a series of standards developed by the International Electrotechnical Commission (IEC) that focus on various aspects of wind energy, including wind turbine design, testing, and certification.
Among other things, the standard defines load assumptions (how to calculate loads, and environmental and operational conditions under which wind turbines should be designed to operate safely and efficiently).
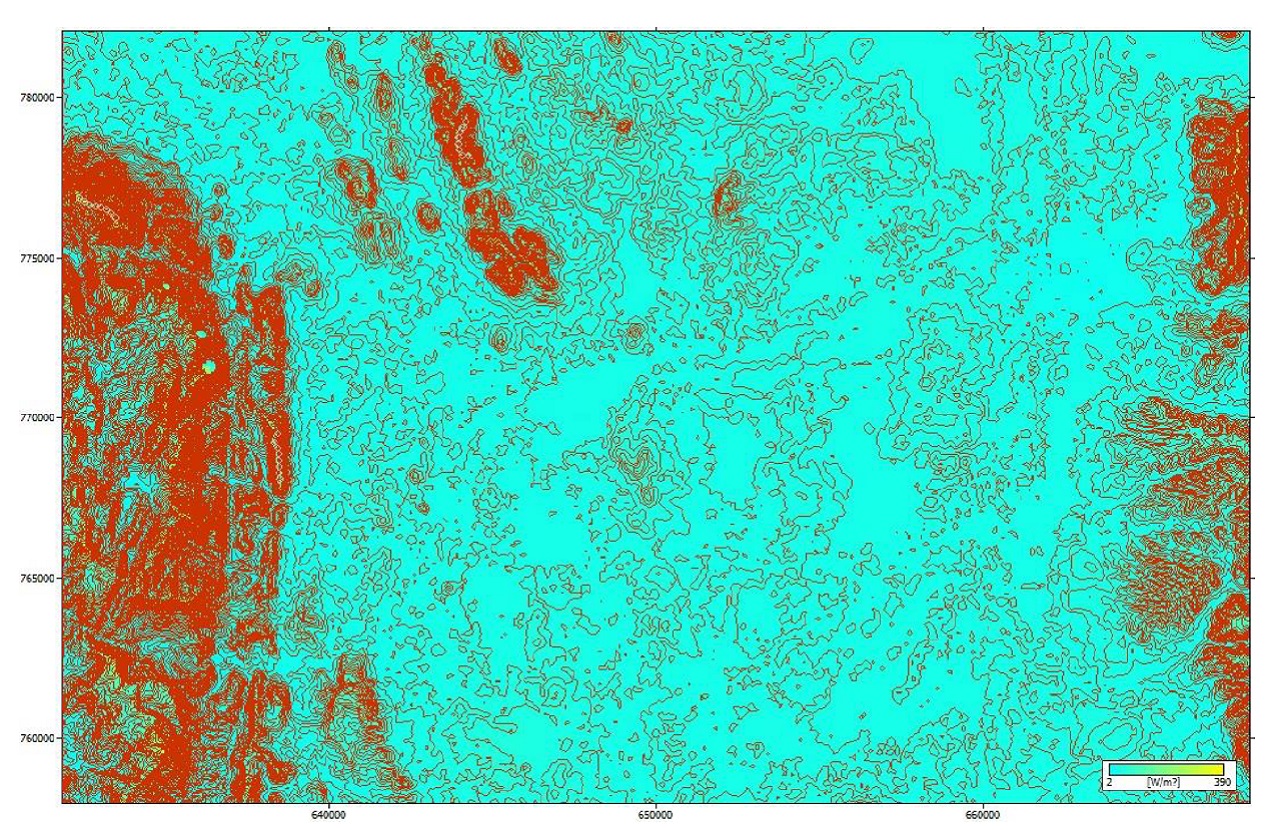
Obviously, the amount of energy produced will depend on the position of the turbine. In the article’s cover image we can see a representation of ‘power density’ – i.e. the points where the wind is best and production can be maximised.
If you are thinking that the best strategy is to pile the turbines where there is the greatest power density, unfortunately things are not that simple.
Often not all land parcels are available – especially in Europe, land ownership tends to be very fragmented.
Afterwards, a minimum distance between the turbines, costs for civil works, losses in the cables to connect the turbines with the substation and many other factors must be considered.
The results of the calculations are usually presented in a table. Here you can see an example:
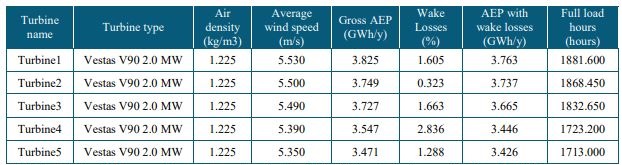
As you can see, it is a table that is several years old (the V90 was a turbine model that was sold when I was young).
However, the main elements are there.
We already introduced Gross AEP: this is the maximum theoretical production, which we would have if there were no losses. Then there are the wake losses and AEP with wake losses.
In the last column you can see how many hours the turbines produce at full power (compared to the theoretical maximum, 8760 hours per year).
Leave a Reply