Category: Wind & Met Mast
-
Wind Measurement — What Can Go Wrong
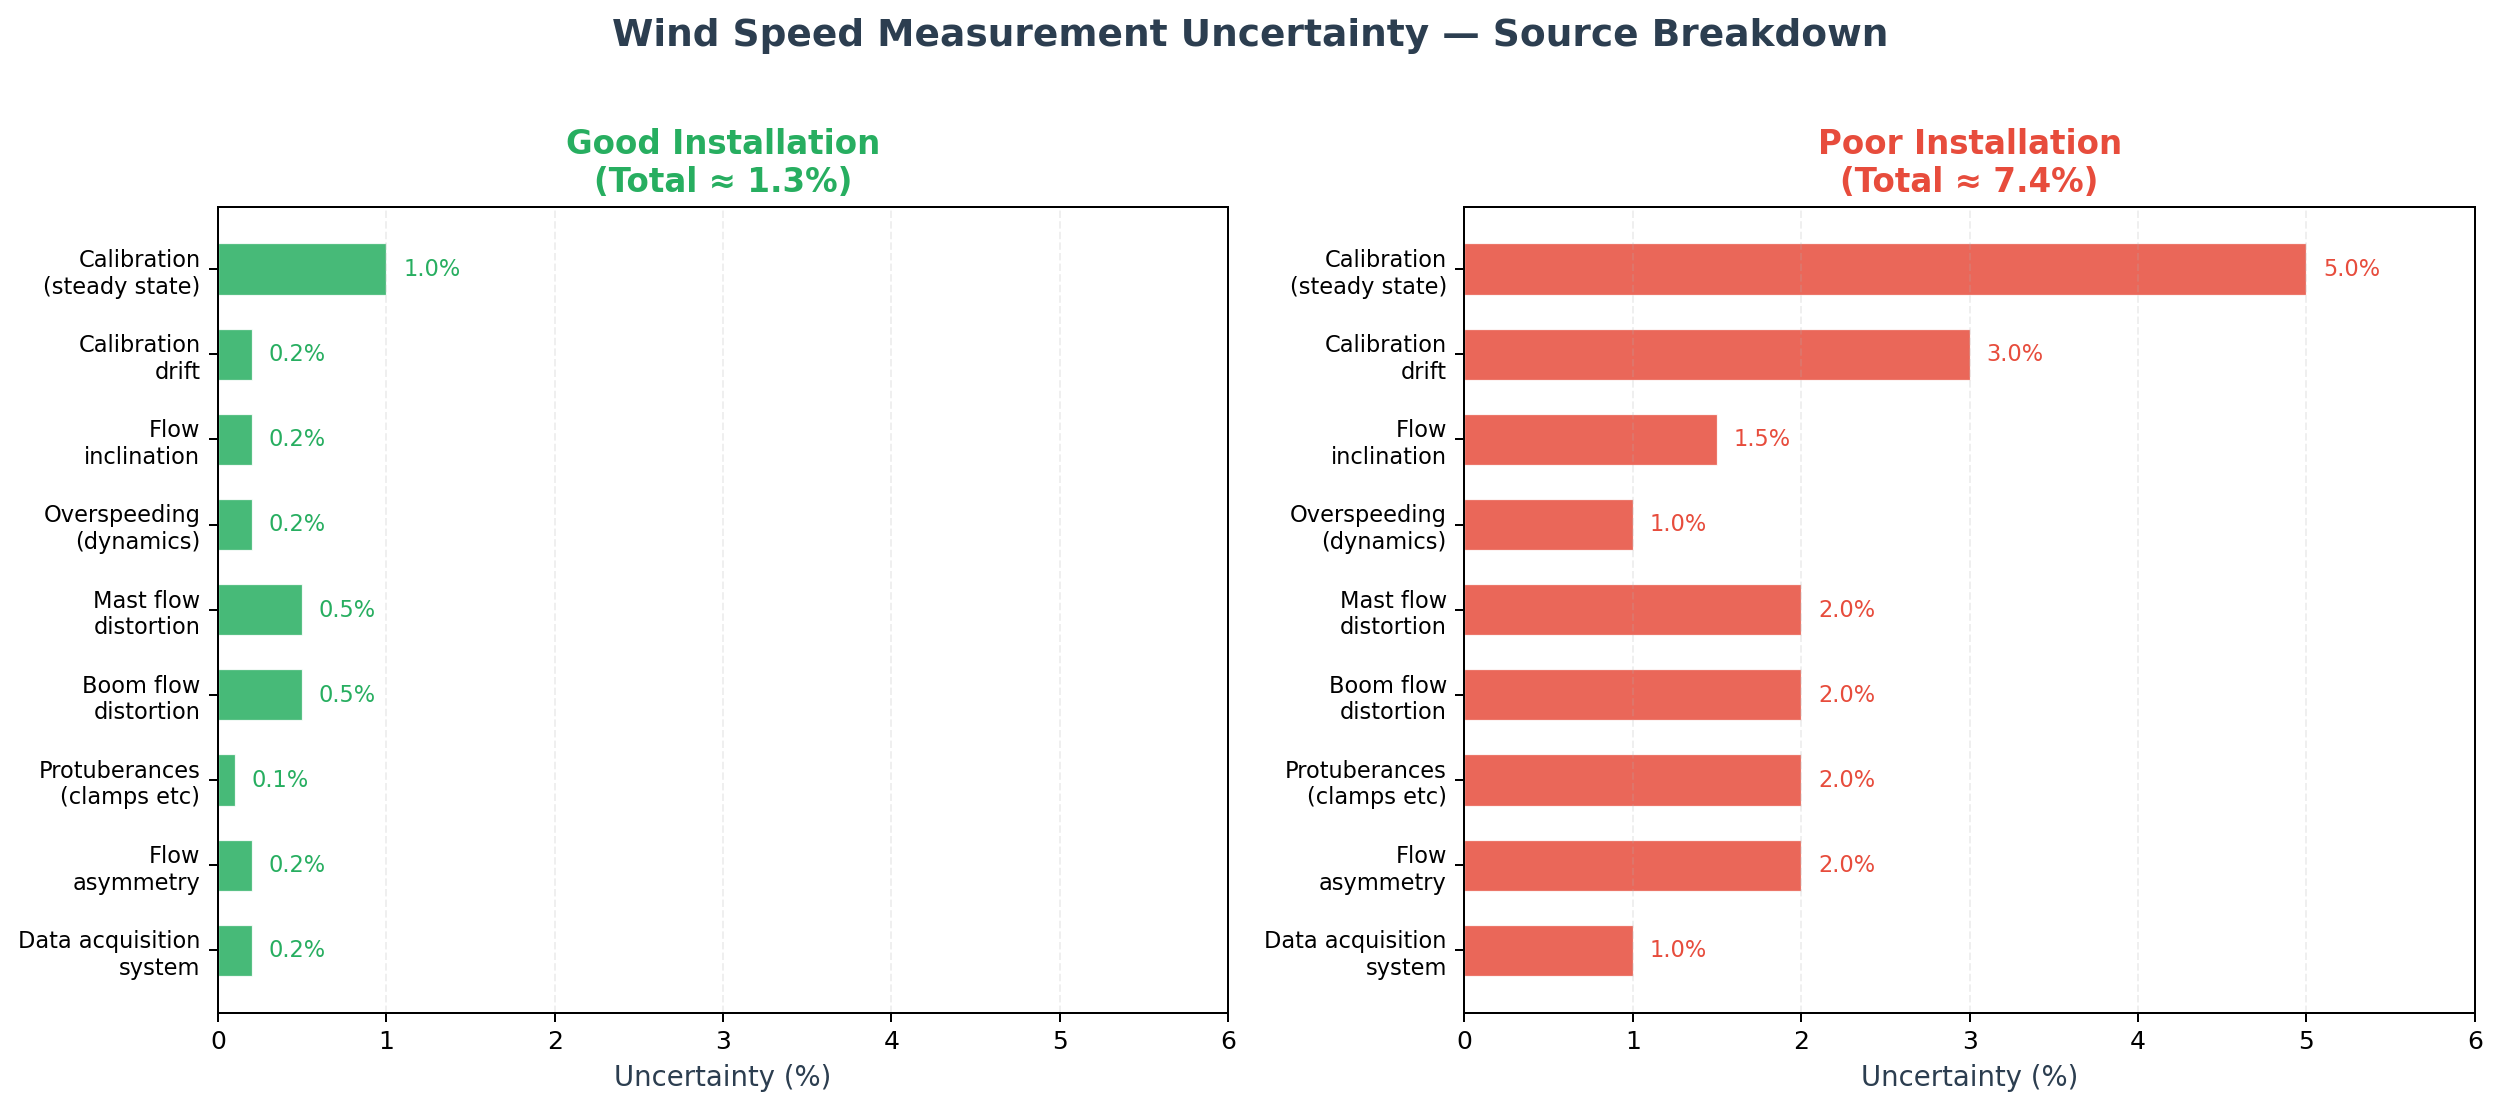
The wind measurement campaign is the foundation of every wind farm project. The instrument at the heart of that campaign — the humble cup anemometer — looks simple, but getting accurate data out of it is anything but. Most of us in the BoP world are not wind resource specialists. We receive the wind assessment…
-
What is a Site Assessment Report?
The Site Assessment report (also known as wind resource assessment or site suitability) is a document containing the results of a detailed study to confirm that a specific turbine model can be used in a project and how much energy it will produce. Both points are extremely important: not only is it necessary for the…
-
WindPro and WAsP
WindPro and WAsP are two software tools used in the wind energy sector. They help developers, investors and wind turbines manufacturers in wind resource assessment. Wind resource assessment is the detailed study of the wind characteristics of the area. It is needed to define which is the most appropriate turbine model to use and what…
-
Wind assessment: uncertainties in the horizontal and vertical extrapolation
Behind every wind farm project there is a technical feasibility study, made to assess the potential for electricity generation of the selected site. At the beginning of the wind farms era wind speed and wind direction was estimated using data from existing weather stations. Due to large differences between predicted energy production and actual generated…
-
How to measure wind resource
I have to start with a disclaimer – I’m not a specialist in wind resource analysis. However, through the year I’ve seen several time this process so I think I can summarize it with a reasonable level of accuracy (and obviously if you spot a mistake, please let me know). The wind resource assessment is…
-
Wind sector management – how to put more wind turbines in the same area
In many project my colleagues from the wind and site department (the people who calculate the best wind turbine model and the optimal layout in a wind farm) are forced to put quite a lot of wind turbines in a reduced space. Each of these wind turbines generate a “wake effect” – basically, they create…
-
Wind site assessment
The wind site assessment (or “wind and site” assessment) is one of the most important steps in the development of a wind farm. Basically is a in depth analysis of the site conditions of the area where a wind farm could be built. Purpose of this assessment is calculate energy production and suitability of a…
-
Guy-wire supported mast for a permanent met mast
Here you have some interesting pictures that we’ve received trying to define the meteorological tower (also known as “met mast”) foundation for one of our wind farms. Strangely, our customer is going to use a wired met mast for both towers (the permanent mast of the wind farm and the temporary mast used to calibrate…
-
Meteorological towers in a wind farm
In a standard wind farm, 3 different Meteorological Tower (known as Met Mast) are installed. First of all, a tower is needed to provide several years (normally at least 2) of wind data. This tower is used to collect not only wind data, but also other information such as temperature, humidity, rain and so on….