There is a good number of techniques that can be used to identify risks.
Some are techniques focused looking at past (every Tender Manager should be able to create a list of issues he had experienced in past projects), other tools are focused on the present (spending a few hours reviewing your current assumptions should help you identify a good number of “what if the assumption is wrong” risks) and other help you to think forward (for instance, a good brainstorming session with stakeholders and experts from different departments).
The outcome of such techniques is a list of risk, usually very long and, above all, unstructured. A qualitative risk assessment can be done, attributing to each risk a “probability and impact score”. My impression is that such exercise is somehow arbitrary (although this is probably better than nothing). What is not provided by the qualitative risk assessment is some visibility on risk patterns, concentrations of risks and correlation between risk causes.
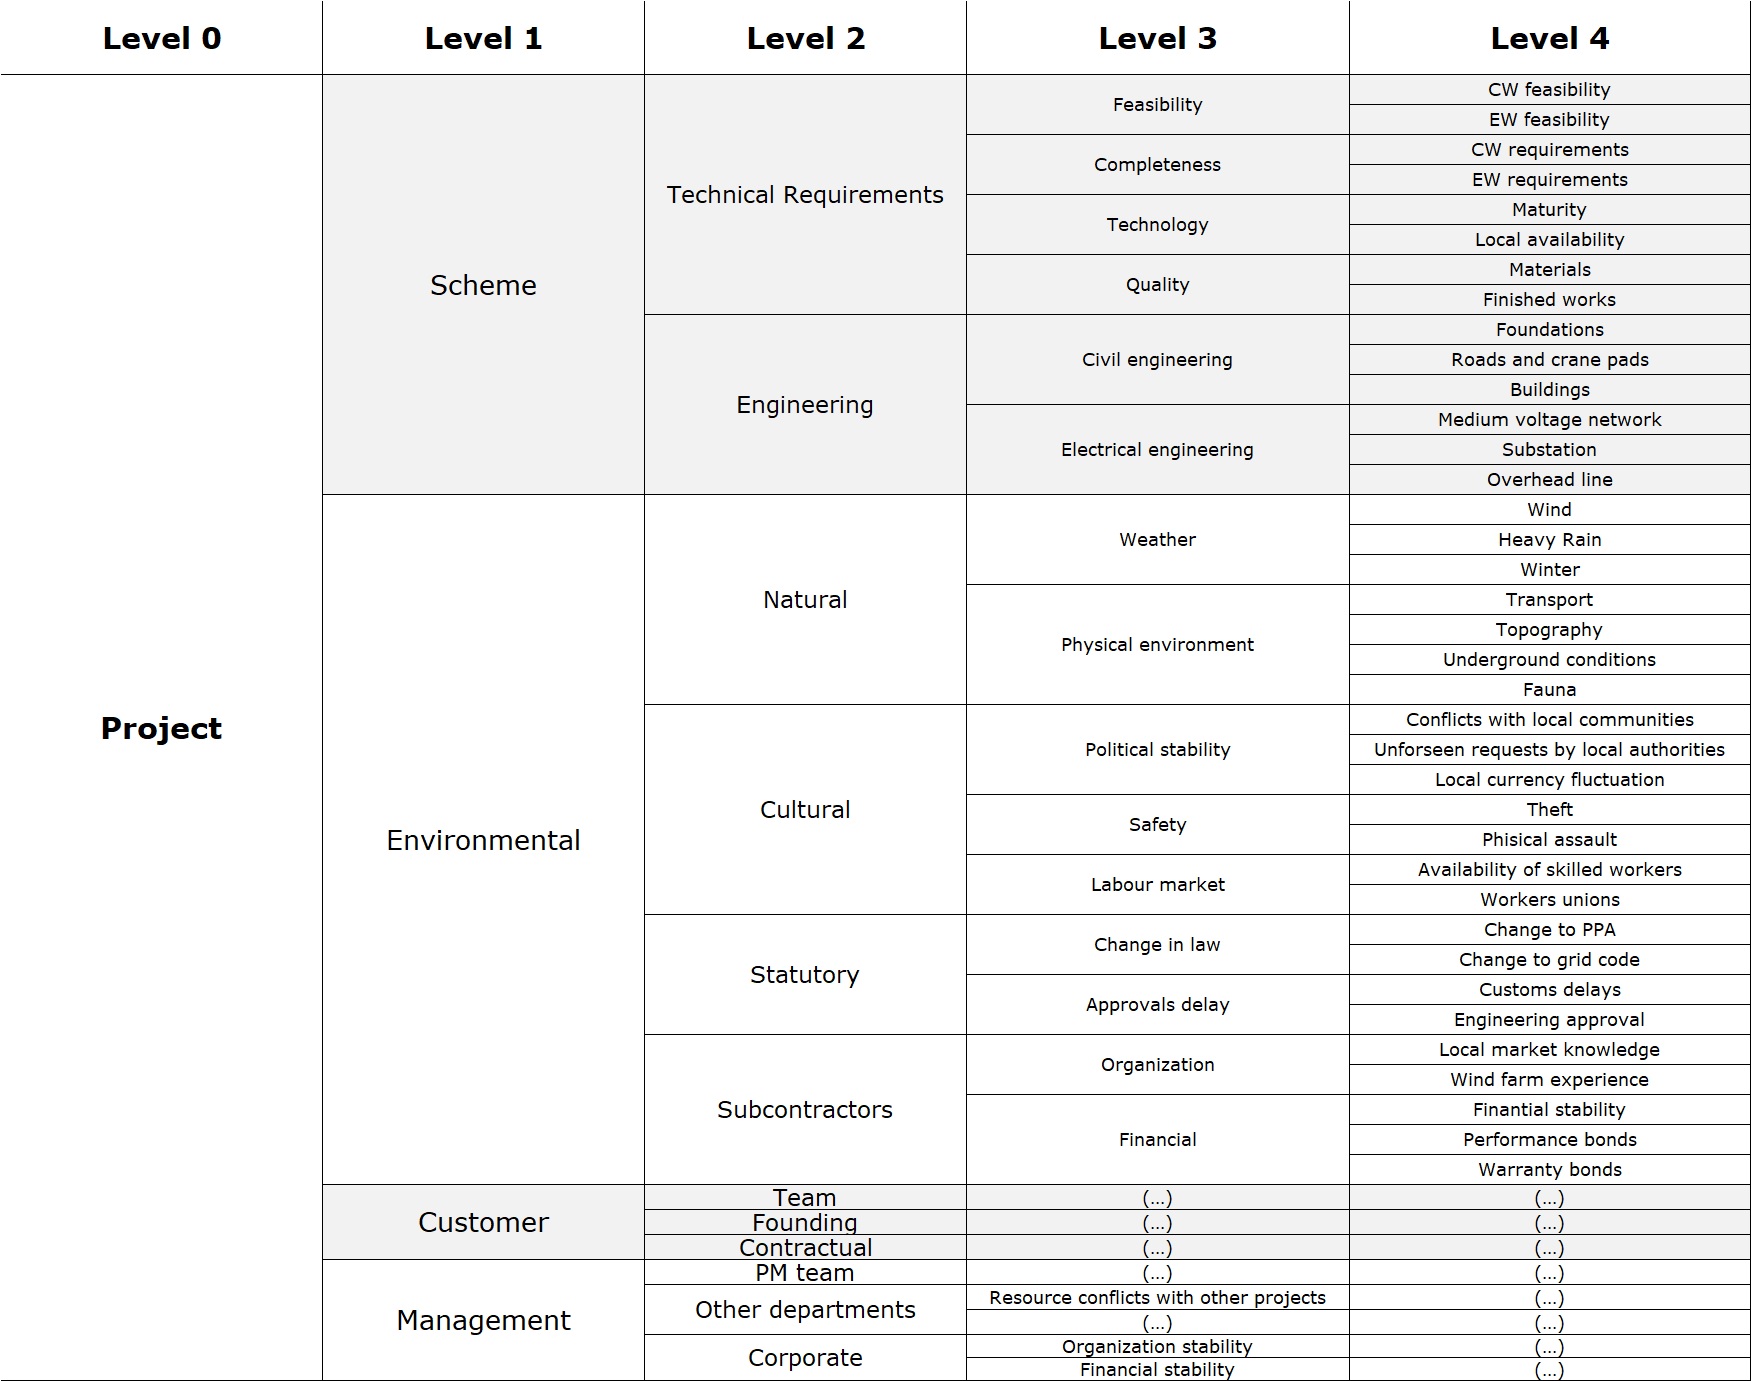
An interesting tool that can be used for such scope is the Risk Breakdown Structure (RBS). Inspired by its more famous counterpart, the Work Breakdown Structure (WBS), it is basically a hierarchical structure (a “taxonomy”) defining several categories and sub-categories for risks. For a wind farm, an example of RBS could for instance consider at the first level the project, the customer, the management (internal) risks and the environmental risk.
Here I’ve made a very rough, unfinished example of how a RBS for a wind farm could look like – as I think it is an interesting exercise I will try to expand it and complete it in the future:
Which are the benefits of such approach?
I believe that the most important one is the identification of high-risk areas: are the majority of your risks coming from the same area? This can help focus the efforts on the most critical aspects. “Majority of risks” should not be considered the absolute number of risks (you can have dozens of low severity risks in the same area). A better way to do it would be to assign a numerical value to each risk, the “Probability x Impact” score and sum the value of such risk scores in all the areas (level 1), subareas (level 2) or sub-subareas (level 3).
Once it has been properly developed the RBS itself can also be used as a checklist for risk identification in future tenders or projects (assuming that your organization is working at comparable projects, as it usually the case in wind farms).
Last but not least, the RBS can be used to compare the risk level and concentration of two or more different tenders or projects, possibly weighting the lowest level risks with their probability / impact score.
Leave a Reply