You don’t need to design blades to understand how they work. But understanding the basics will make you a better project engineer.
This is an aerodynamics crash course with the practical essentials that a BoP engineer should have in their mental toolkit.
Let’s start from first principles. A wind turbine converts kinetic energy from moving air into mechanical rotation, and then into electricity. The power available in a stream of air passing through an area A at velocity v is:
P = ½ · ρ · A · v³
Three things jump out of this equation. First, power is proportional to the cube of wind speed — double the wind speed and you get eight times the power. This is why site selection and hub height matter so much. Second, power scales linearly with the swept area, which is why rotor diameters have grown from 30 metres in the 1990s to over 170 metres today. Third, air density (ρ) plays a role — around 1.225 kg/m³ at sea level and 15°C, but it drops at higher altitudes and warmer temperatures, which has real consequences for energy production.
But a turbine cannot capture all of the available power. If it did, the air behind the rotor would have zero velocity — it would pile up and stop flowing through the rotor entirely. In 1919, the German physicist Albert Betz demonstrated that the maximum fraction of kinetic energy that can be extracted by an ideal rotor is 16/27, or approximately 59.3%. This is the Betz limit, and it is an absolute theoretical ceiling that no wind turbine — no matter how perfectly designed — can exceed.
In practice, modern turbines achieve a power coefficient (Cp) of around 0.45 to 0.50 at their optimal operating point. The gap between the theoretical 0.593 and the real-world 0.50 comes from aerodynamic losses at the blade tips and root, wake rotation, drag on the blades, and mechanical losses in the drivetrain. A Cp of 0.50 is actually an impressive engineering achievement — it means we are capturing roughly 85% of what physics allows.
The Airfoil: Where the Magic Happens
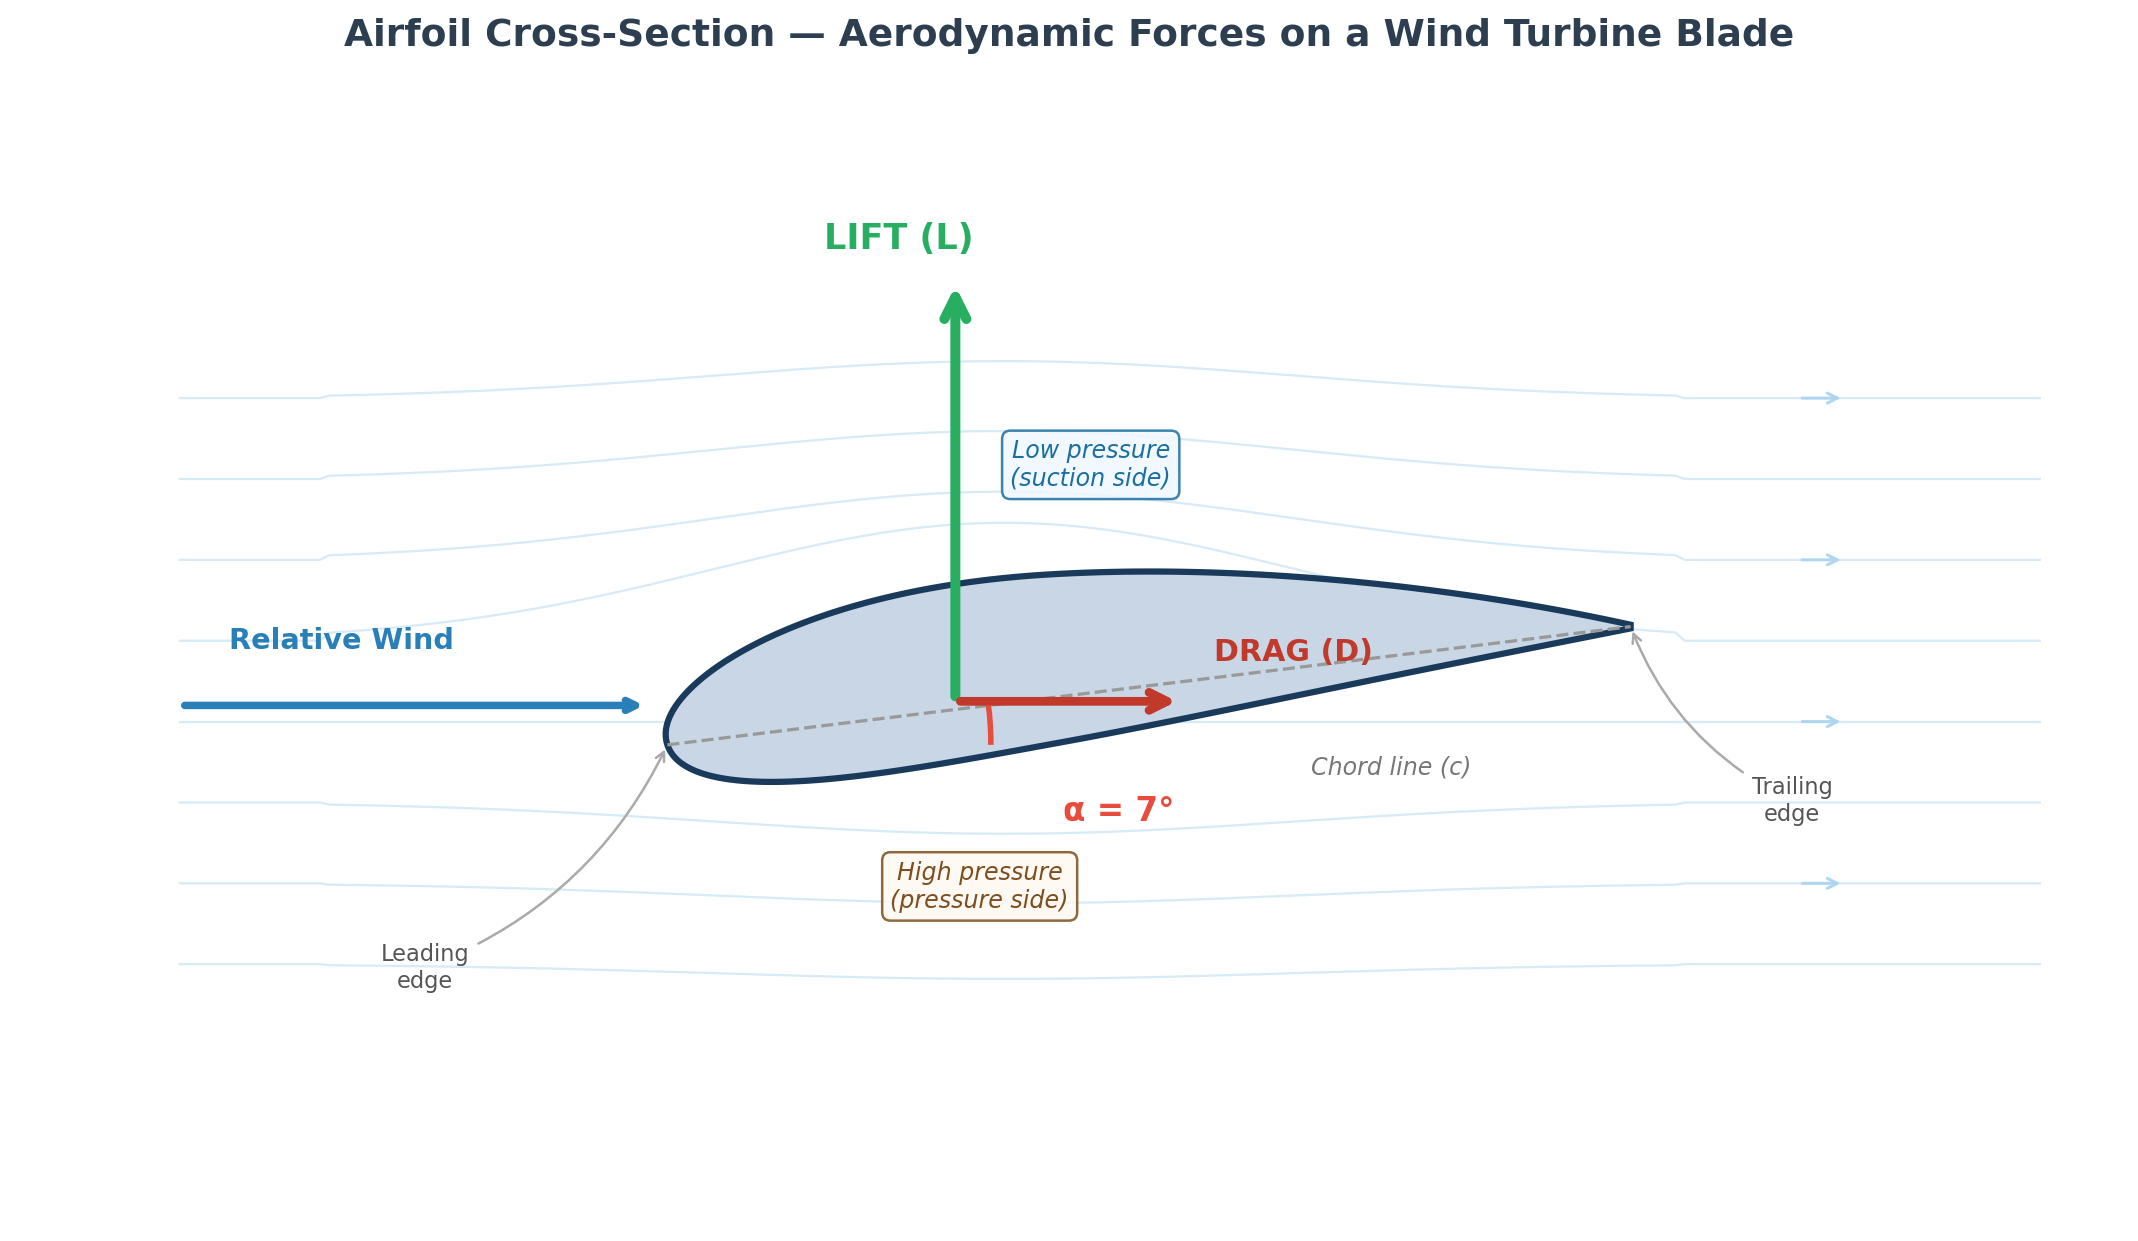
The blade of a wind turbine is not a flat plate. In cross section, each blade has an airfoil shape — a carefully designed profile that looks much like the wing of an aircraft. Understanding how an airfoil works is the single most useful piece of aerodynamic knowledge for a non-specialist.
An airfoil has a rounded leading edge (the front that meets the incoming air), a sharp trailing edge (the back), and a curved shape that is thicker on one side. The imaginary straight line from leading edge to trailing edge is called the chord. The chord length and the curvature of the profile (called the camber) vary along the blade span.
When air flows over the airfoil, it follows the curved surface. The air flowing over the longer, more curved side accelerates and creates a region of lower pressure, while the air on the other side maintains higher pressure. This pressure difference generates a force perpendicular to the airflow — this is lift. At the same time, friction and pressure imbalances create a smaller force parallel to the airflow opposing the motion — this is drag.
The angle between the incoming airflow and the chord line is called the angle of attack (α). This is the single most important variable in airfoil performance. At small angles of attack (say 2–8°), lift increases roughly linearly as you increase the angle. The ratio of lift to drag (L/D) is high, meaning you are generating a lot of useful force with relatively little resistance — this is where you want to operate.
As the angle of attack increases beyond about 10–12°, something changes. The airflow can no longer follow the curved surface smoothly and begins to separate from the blade. Lift stops increasing, drag rises sharply, and eventually the airfoil stalls — typically somewhere around 13–15° for the profiles used in wind turbines. Stall is not always a catastrophic event (in fact, some turbines use it deliberately as a power control mechanism), but it represents a fundamental aerodynamic limit.
The airfoil profiles used in wind turbines are not the same as those used in aviation. Turbine blades are thicker (relative to their chord length) because they need to be structurally strong — they have to support their own weight plus enormous bending loads from the wind. Near the root of the blade, where structural demands are greatest, profiles can be 40% thick. Near the tip, where aerodynamic efficiency matters most, they thin down to around 15–18%. Families of airfoil profiles have been developed specifically for wind turbines — the NACA series, the Risø profiles, the DU (Delft University) series, and the FFA profiles from Sweden, among others.
Blade Design: Twist, Chord, and Tip Speed
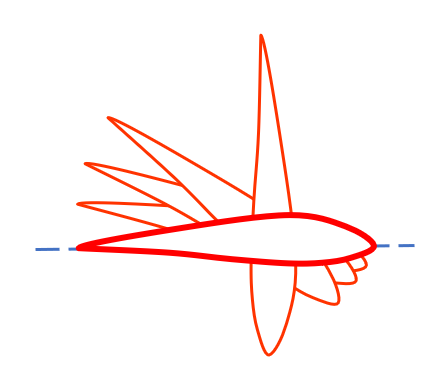
Here is something that is not immediately obvious: the wind that a blade “sees” is not simply the wind blowing from the front. Because the blade is rotating, the effective airflow it experiences is a combination of the actual wind speed and the rotational speed of the blade itself. This combination produces the relative wind — and its angle changes along the length of the blade.
Think about it this way. Near the hub, the blade moves slowly (small radius, low tangential velocity), so the relative wind comes mostly from the front. Near the tip, the blade moves very fast (large radius, high tangential velocity — often around 60–80 m/s at the tip), so the relative wind comes much more from the direction of rotation. If the blade were a simple flat plank at a fixed angle, the angle of attack would vary enormously from root to tip. Near the hub it would be too high (stalled), and near the tip it would be too low (barely generating any lift).
The solution is twist. A wind turbine blade is twisted along its length — typically around 15–20° of total twist from root to tip. The root section is angled steeply into the wind, while the tip is nearly flat relative to the plane of rotation. This ensures that the angle of attack stays within the optimal range (somewhere around 5–8°) along the entire span of the blade.
The chord length also varies. It is widest near the root (where it needs to generate force at low relative wind speeds) and narrows toward the tip (where the relative wind is fast and a shorter chord is sufficient). This taper, combined with the twist, gives the blade its characteristic shape — wide and angled at the base, narrow and flat at the tip.
The relationship between the tip speed and the wind speed is captured by the tip speed ratio (λ, lambda):
λ = (ω · R) / v
where ω is the angular velocity, R is the rotor radius, and v is the wind speed. Modern three-bladed turbines are designed to operate at an optimal tip speed ratio of around 7–9. The control system adjusts rotational speed (or blade pitch) to keep the turbine operating near this optimal point across a range of wind speeds.
The tip speed itself is worth knowing as a number. Most modern turbines operate with tip speeds in the range of 60–80 m/s. Some go higher, but there are practical limits: aerodynamic noise increases roughly with the fifth power of tip speed, and beyond about 80 m/s the noise emissions can become a serious constraint, particularly for onshore projects near residential areas.
Power Curves and Operating Regions
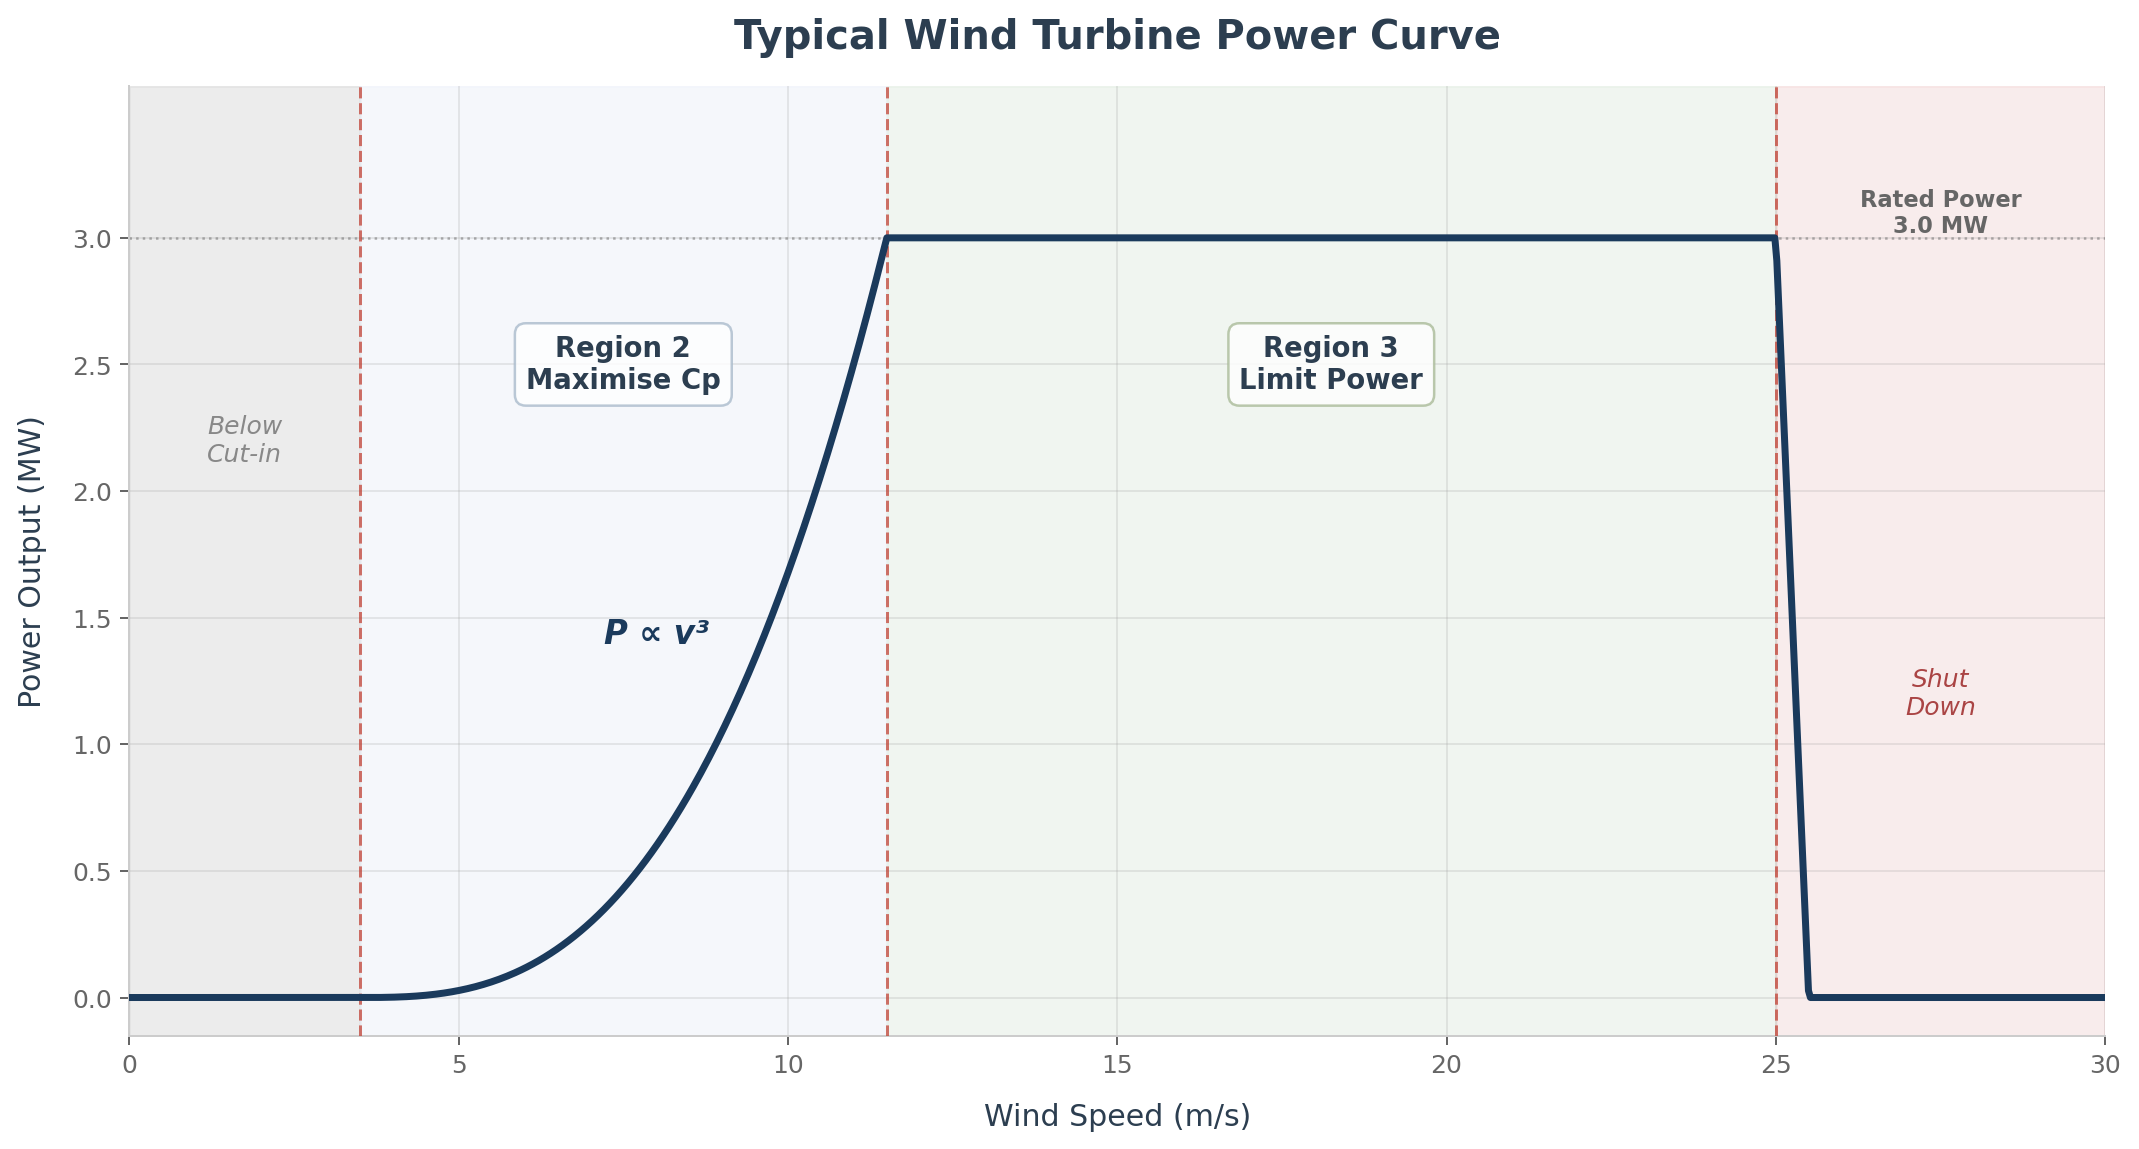
Every wind turbine has a power curve — a graph that shows how much electrical power the turbine produces at each wind speed. If you work in wind energy, you will encounter power curves constantly: in energy yield assessments, in turbine procurement, in performance monitoring, and in contractual guarantees.
A typical power curve has three distinct regions. The first is below the cut-in wind speed (usually around 3–4 m/s), where the wind simply does not carry enough energy to overcome friction and start generating. The turbine either idles or is parked.
The second region is between cut-in and rated wind speed (roughly 4–12 m/s, depending on the turbine). In this region, the turbine is trying to capture as much energy as possible. The control system adjusts the rotor speed (and sometimes the blade pitch) to maintain the optimal tip speed ratio and maximise Cp. Power output rises steeply — remember, it goes with the cube of wind speed.
The third region is above rated wind speed. Here the turbine has reached its maximum power output (the “rated power” — say 3 MW, 5 MW, or whatever the nameplate capacity is) and the control system must actively limit the energy captured to prevent overloading the generator and the structure. The power curve flattens into a horizontal line.
Finally, at very high wind speeds (typically 25 m/s for IEC Class I turbines), the turbine shuts down entirely — this is the cut-out wind speed. The loads at extreme wind speeds are simply too high, and the turbine is designed to survive these conditions parked with the blades feathered, not to operate through them. Some modern turbines have introduced “soft cut-out” strategies where they gradually reduce power above 25 m/s rather than shutting down abruptly, which reduces the shock on the grid and captures a bit more annual energy.
Power Control: Stall vs. Pitch
How does a turbine limit its power above rated wind speed? This is where the two main families of power control strategy come in, and understanding the difference is useful for any wind energy professional.
Passive Stall
The earliest commercial wind turbines (and many turbines produced through the 1990s and early 2000s) used passive stall regulation. In this design, the blades are fixed — they cannot rotate about their longitudinal axis. The blade is aerodynamically designed so that, as wind speed increases beyond rated, the angle of attack at the outer sections naturally exceeds the stall angle. The airflow separates, lift drops, drag increases, and the power is limited.
The beauty of passive stall is its simplicity. No pitch bearings, no pitch motors, no pitch control system. The blades are bolted to the hub at a fixed angle and the aerodynamics do all the work. This was an important advantage in the early days of the industry, when reliability was a major concern and every additional moving part was a potential failure mode.
The drawback is that the power curve is harder to control precisely. Stall is a somewhat unpredictable phenomenon — it depends on surface roughness, turbulence, air density, and other factors. Passive stall turbines often show a slight drop in power above rated wind speed (the power curve “droops”) rather than the flat plateau of a pitch-regulated machine. They also tend to experience higher structural loads during stall, because the turbulent separated flow creates fluctuating forces on the blades.
Active Stall
Active stall is a hybrid approach. The blades have pitch mechanisms (they can rotate about their axis), but instead of pitching to feather (reducing the angle of attack), they pitch slightly into stall — increasing the angle of attack by a few degrees to provoke controlled stall. This gives better control over the rated power level while still using the stall phenomenon to limit power.
Active stall was used in some larger turbines from the late 1990s and early 2000s (the NEG Micon NM series used this approach, for example). It offered a middle ground between the simplicity of passive stall and the precision of full pitch regulation.
Pitch Regulation
Today, virtually all new wind turbines use pitch regulation. Each blade can be rotated (pitched) about its longitudinal axis, independently, by an electric or hydraulic motor. Below rated wind speed, the blades are held at their optimal angle and the control system varies rotor speed to maximise energy capture. Above rated wind speed, the blades are pitched towards feather — the angle of attack is reduced, lift decreases, and power is held constant at the rated level.
Pitch regulation gives precise control over the power output and significantly reduces the structural loads on the turbine compared to stall-regulated machines. The loads are more predictable, which allows for lighter (and cheaper) structural design. The pitch system also provides a crucial safety function: in an emergency, the blades can be pitched fully to feather (90°), which effectively stops the rotor aerodynamically. This is a primary braking mechanism.
The combination of pitch regulation and variable speed (PRVS — Pitch Regulated Variable Speed) is the standard for all modern utility-scale turbines. The control system is constantly adjusting both rotor speed and blade pitch angle to optimise energy capture in partial load and limit power in full load. It is a sophisticated feedback loop that responds to wind speed changes on a timescale of seconds.
A Word on Loads
I won’t go deep into structural loads — that is a topic for the turbine designers and the certification bodies. But a few concepts are worth knowing because they directly affect the BoP.
Wind turbines are designed according to IEC 61400-1, the international standard that defines turbine classes based on wind speed and turbulence. The key classes are:
- Class I: sites with high average wind speed (up to 10 m/s annual average, reference speed 50 m/s)
- Class II: medium wind sites (up to 8.5 m/s, reference 42.5 m/s)
- Class III: low wind sites (up to 7.5 m/s, reference 37.5 m/s)
Each class is further subdivided by turbulence intensity (A = higher turbulence, B = lower, C = even lower). A Class IIA site, for instance, has medium average wind speed with moderate turbulence.
Why does this matter for BoP? Because the turbine class determines the extreme loads, which in turn determine the foundation design. A Class I turbine on a high-wind site will transmit significantly higher overturning moments to its foundation than a Class III turbine on a gentle site. Foundation dimensions, rebar quantities, and concrete volumes are all directly driven by these loads. When I receive the turbine loading document for a new project, the first things I look at are the extreme overturning moment (Mxy) and the vertical force (Fz) — these two numbers drive most of the foundation engineering.
The loads on a wind turbine are a complex combination of aerodynamic forces (from the wind hitting the rotor and the tower), gravitational forces (the sheer weight of the nacelle and blades), and dynamic effects (vibrations, resonance, fatigue). The design life is typically 20–25 years, and the turbine must survive millions of load cycles over that period. This is why the foundation design is so conservative — a wind turbine foundation is not just holding up a static weight; it is resisting cyclic, dynamic loads that change direction and magnitude constantly.
Aerodynamic Noise
I want to touch briefly on aerodynamic noise, because it is increasingly one of the most important constraints on wind farm layout design — and therefore it directly affects the BoP.
The dominant noise source on a modern wind turbine is aerodynamic, not mechanical. The gearbox and generator contribute relatively little to the overall sound level compared to the blades moving through the air. The main mechanisms are:
Trailing edge noise, caused by the turbulent boundary layer passing over the sharp trailing edge of the blade. This is the largest single noise source and produces the characteristic “whooshing” sound. Tip noise, generated by the vortex that forms at the blade tip where the high-pressure and low-pressure sides meet. Blade manufacturers have mitigated this significantly with serrated trailing edges and curved tip designs (winglets). And turbulent inflow noise, caused by atmospheric turbulence hitting the leading edge of the blade — this one depends more on site conditions than on blade design.
As I mentioned earlier, noise scales roughly with the fifth power of tip speed. This means that even a small increase in rotor diameter (and therefore tip speed, for a given rotational speed) can have a disproportionate impact on noise emissions. Noise is typically the binding constraint for turbine placement in onshore projects near residential areas, and it often forces layout compromises that reduce energy yield. I have worked on projects where we had to move turbine positions 50 or 100 metres to comply with noise limits, which then changed the road layout, the cable routes, and the crane pad positions. Aerodynamics reaches deep into the BoP.
Many modern turbines offer a noise-reduced operating mode where the control system limits rotor speed or pitch angle during certain hours (typically at night) to reduce noise emissions by 1–3 dB. The cost is a reduction in energy output — usually a few percent of annual production — but it can be the difference between getting planning permission and not.
Leave a Reply