The wind measurement campaign is the foundation of every wind farm project. The instrument at the heart of that campaign — the humble cup anemometer — looks simple, but getting accurate data out of it is anything but.
Most of us in the BoP world are not wind resource specialists. We receive the wind assessment report, we look at the position of the turbines and the Weibull parameters and we use those numbers to design the layout and size cables. We trust the data.
However, you should understand how that data is collected, because the quality of the wind measurements propagates through every design decision subsequently made.
A 2% systematic error in wind speed could translates to a much bigger error in energy production (since power is proportional to the cube of wind speed), and that can be the difference between a bankable project and one that underperforms its financial model for twenty years.
In this post I want to go through the main things that can go wrong with cup anemometer measurements, and what to look for if you ever visit a met mast site or review a measurement setup report.
The cup anemometer — deceptively simple
A cup anemometer consists of three hemispherical or conical cups mounted on arms that rotate around a vertical axis. Wind pushes the open side of each cup harder than the back, creating a net torque that makes the assembly spin. The rotation speed is proportional to the wind speed, and an electrical signal (typically pulses from a reed switch or optical encoder) is sent to the data logger.
It sounds like a device that should just work. And in principle it does — cup anemometers are robust, relatively inexpensive, resistant to outdoor conditions, and they have been the industry standard for wind energy measurements for decades. But the devil is in the details of design, calibration, and installation.
If you look closely at two cup anemometers from different manufacturers, you will notice differences that might seem cosmetic but have real consequences for measurement accuracy. The cup geometry (hemisphere vs cone, the ratio between cup radius and arm length), the body shape (smooth and symmetric vs angular with protuberances), the shaft length (long enough to keep the cups away from the disturbed flow around the body, or not), and the signal generation mechanism — all of these affect how the instrument responds to the wind.
A well-designed anemometer has cups with carefully optimised geometry for consistent vertical sensitivity and dynamic response, a long shaft to minimise flow disturbance from the body, a small and symmetric body with smooth profiles, and high-quality bearings with low friction. A poorly designed one has the opposite — and the difference in measurement accuracy can easily reach 1–2%, which is enormous when you consider its impact on the energy yield estimate.
Overspeeding — the invisible bias
This is perhaps the most interesting source of error in cup anemometers, because it is systematic, always positive, and impossible to detect by looking at the data alone.
Cup anemometers respond faster to increases in wind speed than to decreases. When a gust hits the cups, the aerodynamic force accelerates them quickly. But when the gust passes and the wind speed drops, the cups slow down more gradually — they have rotational inertia, and the aerodynamic drag in the decelerating direction is lower. The result is that in turbulent, fluctuating wind (which is the real wind, always), the time-averaged reading is slightly higher than the true time-averaged wind speed.
This effect is characterised by the anemometer’s distance constant, usually designated as d or 1/a. The distance constant is defined as the length of air that must pass through the anemometer before it registers 63.2% of a step change in wind speed. For energy-grade cup anemometers, the distance constant typically ranges from 2 to 3.5 meters. A smaller distance constant means the anemometer responds faster and has less overspeeding.
The overspeeding error can be estimated with a remarkably simple formula: E = I² × (1.8d − 1.4), where E is the error in percent, I is the turbulence intensity (as a fraction, not percent), and d is the distance constant in meters. For a typical site with 12% turbulence intensity and a good anemometer with d = 2.5 m, the overspeeding error is 0.12² × (1.8 × 2.5 − 1.4) = 0.0144 × 3.1 = 0.045%, which is negligible. But for a rougher site with 18% TI and a slower anemometer with d = 3.5 m, it becomes 0.18² × (1.8 × 3.5 − 1.4) = 0.0324 × 4.9 = 0.16% — still small in absolute terms, but it accumulates systematically and always in the same direction.
The key point for the BoP engineer is not to calculate overspeeding (that is the wind analyst’s job), but to understand that LIDAR and ultrasonic anemometers do not suffer from it, and that this is one of the reasons why modern measurement campaigns increasingly use remote sensing as a cross-check.
Mounting errors — where the real problems hide
In my experience, the single biggest source of measurement error is not the anemometer itself but how it is installed on the met mast. The mounting introduces flow distortion that can easily exceed the instrument’s own calibration uncertainty, and unlike overspeeding, the errors from bad mounting can be very large — several percent — and are often not fully corrected in post-processing.
The met mast is an obstacle in the wind. It deflects the flow, creates zones of acceleration and deceleration, and generates turbulence in its wake. The anemometer must be positioned where this perturbation is minimised.
For a tubular tower (circular cross-section), the flow pattern is well understood from potential flow theory. The wind accelerates as it goes around the tower and decelerates in the upstream and downstream zones. The minimum perturbation occurs at approximately 45° from the wind direction. If the boom holding the anemometer is oriented at 45° to the prevailing wind, the separation between the anemometer rotor and the tower axis should be at least 4 tower diameters to keep the flow distortion below 1%. If the boom points directly upwind (which is sometimes done for practical reasons), the required separation increases to 6.1 diameters for 1% accuracy, or 8.2 diameters for 0.5%.
For a lattice tower (triangular cross-section), which is the most common type for met masts, the minimum perturbation occurs at 90° from the wind direction. The minimum separation is 3.7 times the side length of the lattice section. The perturbation depends on the tower’s thrust coefficient C_T, which is a function of the tower’s solidity — the ratio of the structural members’ projected area to the total face area.
These are the numbers from the IEC standards and published research. In practice, I have seen met masts where the booms were too short, where the anemometers were mounted on rectangular (not circular) booms, where cables were hanging loose on the outside of the boom with plastic zip ties acting as protuberances, and where the lightning rod was mounted next to the anemometer without adequate clearance. Every one of these issues introduces a flow distortion that degrades the measurement.
Tower shadow — the blind spot
When the wind comes from behind the met mast (relative to the anemometer position), the tower blocks the flow and the anemometer sits in the tower’s wake. The measured wind speed in this sector is significantly lower than the true wind speed — this is called the tower shadow effect.
The affected sector depends on the tower type and the anemometer position, but it is typically 30 to 60 degrees wide. Data from this sector must be identified and excluded during post-processing, then replaced with synthetic values generated from the other anemometers on the mast or from a statistical model.
This is standard practice and every competent wind analyst handles it. But it is worth understanding because it means that every single met mast dataset has a sector where the wind speed is not directly measured but reconstructed. If the prevailing wind happens to come from a direction close to the tower shadow sector, the reconstruction affects a significant fraction of the energy-producing hours, and the uncertainty increases.
Using two anemometers at the same height, mounted on booms pointing in opposite directions (180° apart), eliminates the tower shadow problem: at any given time, at least one anemometer is in clean flow. The data logger selects the upwind anemometer for each 10-minute interval based on the wind direction. This dual-anemometer configuration is now considered best practice for measurement campaigns.
Calibration drift and environmental damage
A cup anemometer is calibrated in a wind tunnel before deployment. The calibration produces a linear transfer function: wind speed = A × frequency + B, where A (the slope) and B (the offset) are specific to that individual instrument. The calibration should be done no more than six months before installation and ideally rechecked within twelve months after the campaign.
But the calibration can drift over time. The bearings wear, the cups get scratched or dented by hail, sand, or debris, and the surface finish changes with UV exposure and oxidation. Salt spray in coastal environments is particularly aggressive. I have read reports where anemometers recovered after two years of operation showed calibration shifts of 1–2% relative to the pre-deployment calibration.
In cold climates, ice and snow accumulation on the cups is a serious problem. Even a thin layer of ice changes the aerodynamic properties of the cups and can cause the anemometer to either over- or under-read, depending on the ice distribution. Some campaigns use heated anemometers to prevent icing, but the heating elements themselves (and their wiring) can introduce flow disturbances. There is no perfect solution — in cold climate sites, the measurement uncertainty is inherently higher, and the wind resource report should reflect this honestly.
Rain is a less obvious issue but still relevant. Water ingress through poorly sealed cable entries or connectors can corrode the bearings and the electrical contacts inside the instrument. The data logger enclosure is another weak point — if it is not properly sealed and the cables do not enter from below (so water cannot run along them into the box), moisture damage to the electronics can cause data gaps or erroneous readings.
Quantifying the total uncertainty
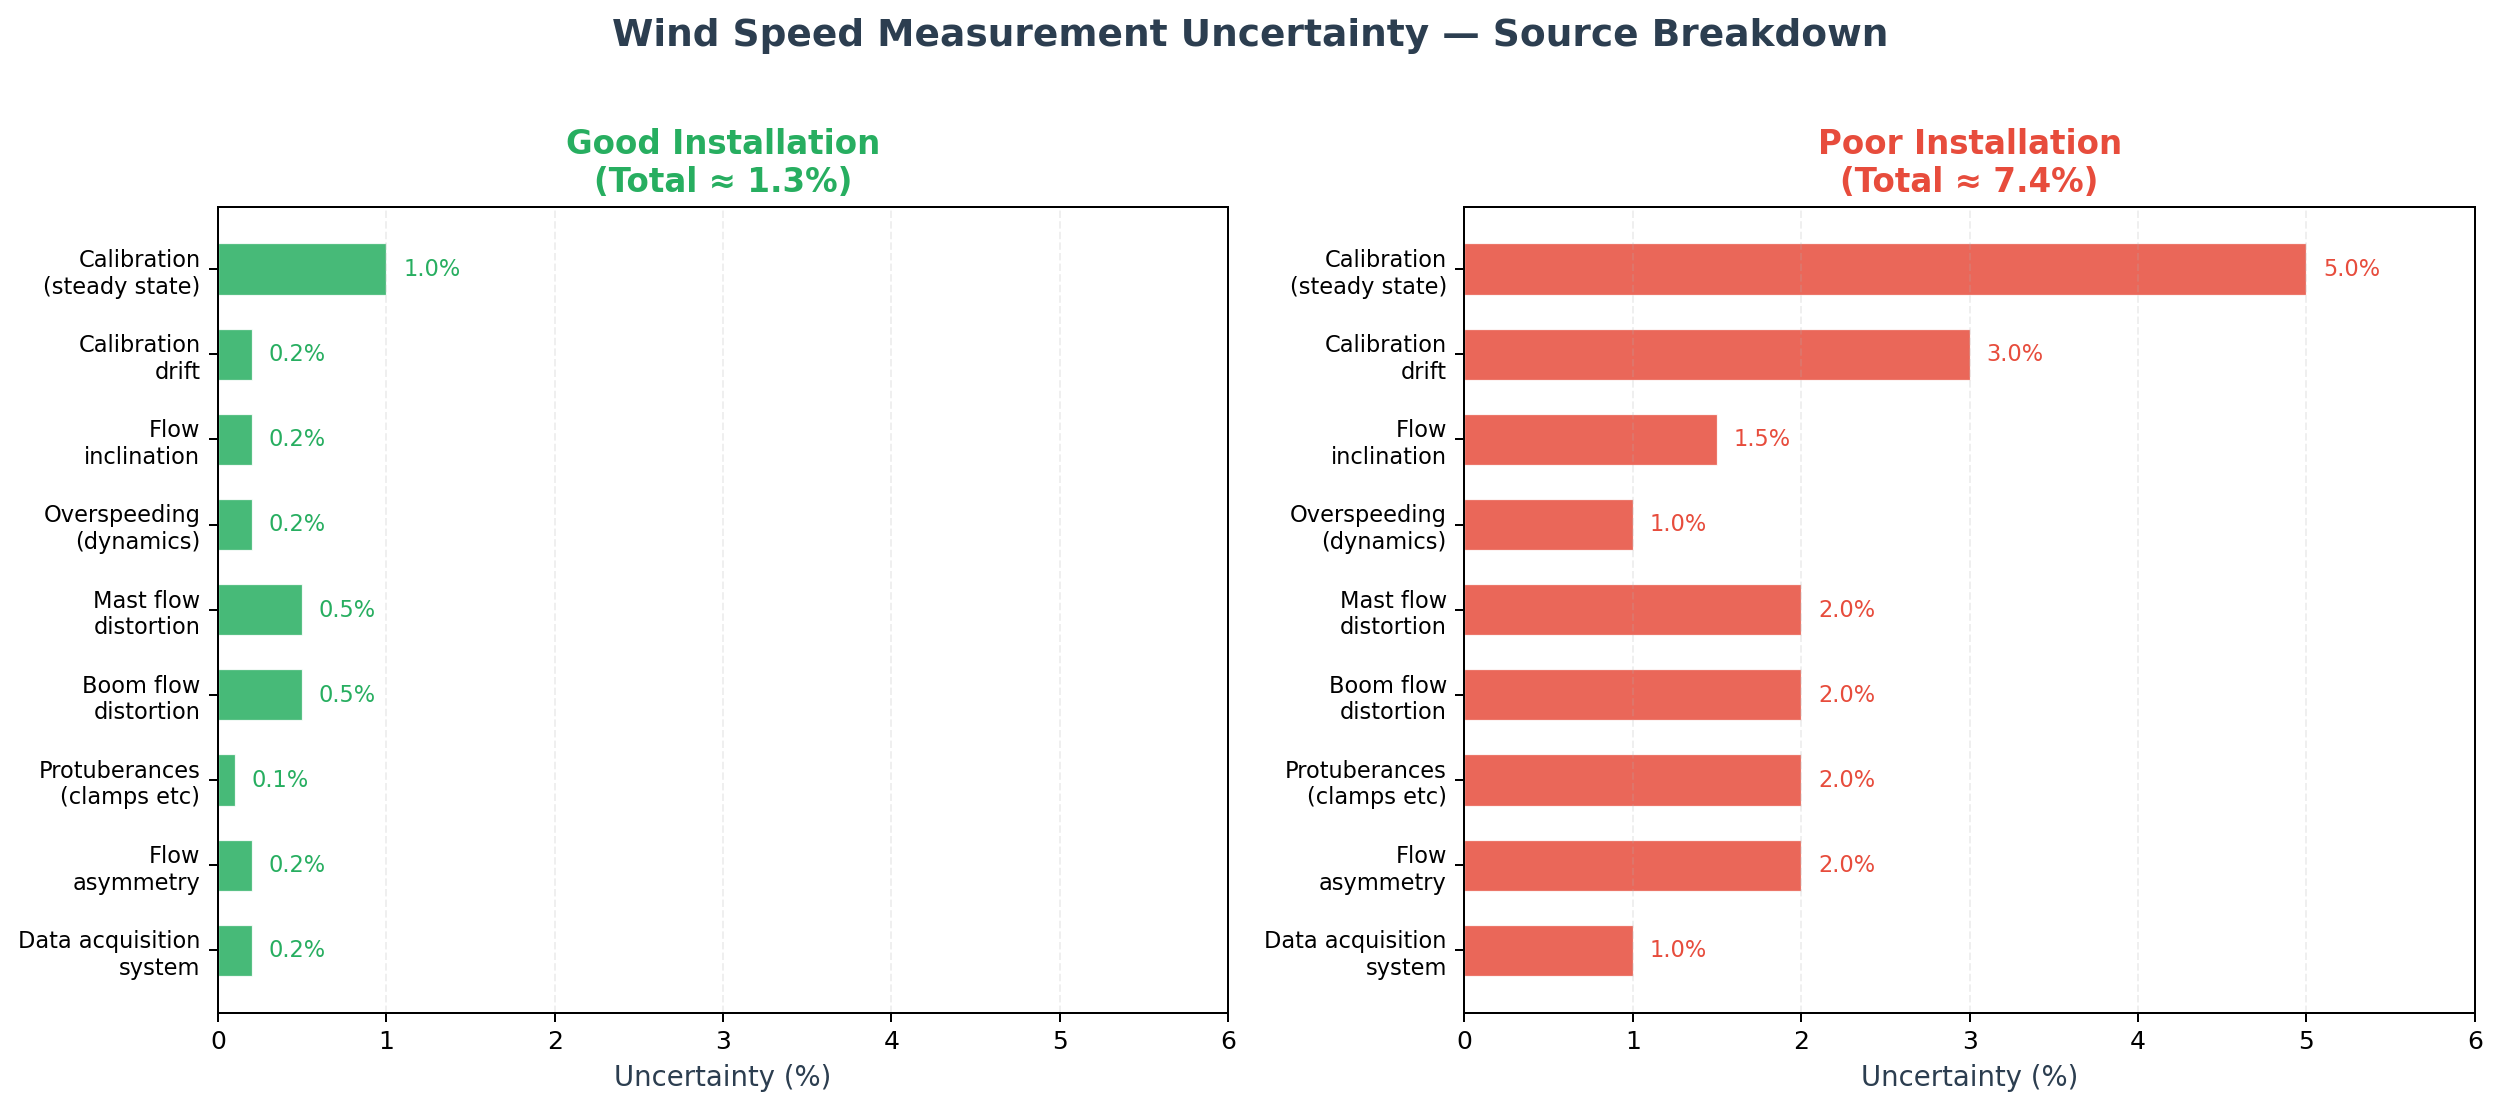
When you combine all the individual sources of error, the total measurement uncertainty for wind speed paints a sobering picture. The numbers below come from the technical literature and represent the range from a carefully executed installation with high-quality instruments to a careless installation with lower-grade equipment:
| Source of error | Good installation | Poor installation |
|---|---|---|
| Calibration (steady state) | 1.0% | 5.0% |
| Calibration drift over time | 0.2% | 3.0% |
| Flow inclination effects | 0.2% | 1.5% |
| Overspeeding (dynamics) | 0.2% | 1.0% |
| Flow distortion — mast | 0.5% | 2.0% |
| Flow distortion — boom | 0.5% | 2.0% |
| Protuberances (clamps, cables) | 0.1% | 2.0% |
| Flow asymmetry on anemometer | 0.2% | 2.0% |
| Data acquisition system | 0.2% | 1.0% |
| Combined total | ~1.3% | ~7.4% |
A 1.3% uncertainty in wind speed is the best you can realistically achieve — and this assumes Class 1 instruments, proper mounting, regular inspections, and careful post-processing. At the other end, a poorly executed campaign can have over 7% uncertainty in wind speed, which translates to roughly 20% uncertainty in energy production. That is the difference between a measurement you can take to the bank and one that is essentially useless for financial decisions.
What to look for during a site visit
If you ever have the opportunity to visit a met mast during a measurement campaign (and as a BoP engineer working on the same site, you probably will), here are the things worth checking:
The boom orientation relative to the prevailing wind — is it at 45° (tubular tower) or 90° (lattice tower)? The boom length — does it provide at least 4D or 3.7L of separation? The boom cross-section — is it circular? Are the cables routed inside the boom and tower, or are they hanging on the outside with zip ties? Is the anemometer clear of guy wires and the lightning rod? Are there any obvious protuberances (clamps, connectors, junction boxes) near the anemometer that could disturb the flow?
You will not be able to assess the calibration or the data quality from a visual inspection, but you can certainly spot the most common mounting errors that lead to large flow distortions. If the installation looks sloppy, the data it produces is likely to have higher uncertainty — and that uncertainty will propagate into the wind resource report, the energy yield estimate, and ultimately into the economic model of the project you are designing the BoP for.
I do not suggest that a BoP engineer should become a wind measurement expert. But understanding these fundamentals helps you ask the right questions when reviewing the wind resource assessment, and it gives you a basis for pushing back if the measurement setup does not meet the standards. In a competitive market where every fraction of a percent of energy yield matters, the quality of the wind measurement is where it all starts.
Leave a Reply